Prof. Dr. Michael A. Kraus, M.Sc.(hons)
Predictive modelling and latent space exploration of steel profile overstrength factors using multi-head autoencoder-regressors
Abstract
This research investigates the suitability and interpretability of a data-driven deep learning algorithm for multi cross sectional overstrength factor prediction. For this purpose, we first compile datasets consisting of experiments from litera-ture on the overstrength factor of circular, rectangular and square hollow sec-tions as well as I- and H-sections. We then propose a novel multi-head en-coder architecture consisting of three input heads (one head per section type represented by respective features), a shared embedding layer as well as a subsequent regression tail for predicting the overstrength factor. By construc-tion, this multi-head architecture simultaneously allows for (i) the exploration of the nonlinear embedding of different cross-sectional profiles towards the overstrength factor within the shared layer, and (ii) a forward prediction of the overstrength factor given profile features. Our framework enables for the first time an exploration of cross-section similarity w.r.t. the overstrength factor across multiple sections and hence provides new domain insights in bearing capacities of steel cross-sections, a much wider data exploration, since the encoder-regressor can serve as meta model predictor. We demonstrate the quality of the predictive capabilities of the model and gain new insights of the latent space of different steel sections w.r.t. the overstrength factor. Our pro-posed method can easily be transferred to other multi-input problems of Scientific Machine Learning.
The publication can be found here and the corresponding presentation video here.
Introduction
The performance of steel structures is influenced by the behavior of their load-bearing components, particularly the flexural characteristics. Designing steel constructions that can provide sufficient local ductility for the development of plastic hinges while maintaining moment capacity is crucial for ensuring a global dissipative mechanism. In the context of bending steel beams, two key parameters, rotation capacity (\(r\)) and flexural overstrength (\(s\)), play a decisive role. Understanding these parameters is essential for achieving safe and reliable structural designs, especially when considering seismic codes such as EN 1998. While empirical methods exist to estimate the rotation capacity \(r\) and flexural overstrength \(s\) of steel members, there is a need for comprehensive analytical estimation, specifically for circular (CHS), rectangular (RHS), and square (SHS) hollow sections, as well as I and H profiles. This study aims to develop a precise and efficient deep learning technique for predicting the flexural overstrength factor of steel beams with different cross sections under pure bending. This technique will enable the identification of latent correlations and provide a better understanding of cross-sectional similarities concerning flexural overstrength \(s\).
Methods
The Flexural Overstrength Factor \(s\)
The flexural overstrength factor \(s\) is a non-dimensional parameter used for characterizing the ultimate bending capacity of steel beams exceeding the plastic bending strength due to the strain hardening [2]. It is originally ([3],[4]) computed by the ratio of the stress fLB corresponding to complete local buckling development or the lateral torsional buckling to the yield stress \(f_y\):
or by the more practical relation using the maximum moment \(M_u\) to the theoretical full plastic moment \(M_p\). The ultimate bearing capacity of steel beams can be significantly greater than the plastic bending strength because of strain hardening before complete local buckling or fractures as given in Figure 1 by the generalized moment-rotation curves. The overstrength factor is used for seismic design in the Italian codes OPCM 3274 (2003) and NTC 2018 but neglected for cross-section classes in Eurocode 3 (EN 1993:1-1).

Figure 1: Generalized moment–rotation curve for a steel beam and EN 1993:1-1 classification criteria.
Database
The databases used for calibrating our deep learning model for predicting the flexural overstrength factor s for CHS, RHS, SHS and I-H steel beams were collected from the available scientific literature. The examined test configurations accounting for different load patterns (i.e. bending moment distribution) and cross-sectional. The databases contain samples covering a wide range of cross-sectional typologies under monotonic loading with different local slenderness ratios. The features consist of geometric properties of the section, mechanical prop-erties of the material, and the shear length of the steel beams.
The data set for circular sections contains 128 samples with features: section diameter \(D\), thickness \(t\), shear length \(L_v\), yield strength \(f_y\). The data set for I-H sections consists of 76 samples with features: flange width \(b_f\), section depth \(d\), flange thickness \(t_f\), web thickness \(t_w\), shear length \(L_v\), flange yield stress \(f_{y,flange}\), web yield stress \(f_{y,web}\), ratio of the modulus of elasticity of steel to the hardening modulus \(E/{E_h}\), and ratio of the strain corresponding to the beginning of hardening to the yield strain \(\epsilon_h/\epsilon_y\). The data set for RHS-SHS sections comprises of 76 samples with features : section width \(b\), section depth \(d\), wall thickness \(t\), inside corner radius \(r\), shear length \(L_v\), yield stress \(f_y\), modulus ratio \(E/{E_h}\), and strain ratio \(\epsilon_h/\epsilon_y\).
Multi-Head Encoder - Regressor Deep Neural Network (MHER-DNN)
This research proposes a novel DL architecture called multi-head encoder - regressor Deep Neural Network (MHER-DNN) for twofold use: (i) prediction of the overstrength factor s for five cross section types (CHS, SHS, RHS, I and H) of various steel grades, and (ii) learning a compressed representation of the cross section specific inputs for subsequent regression but also domain-informed inspection. Note, that the MHER-DNN architecture as provided in Fig. 5 is solely used for training as proxy combining the individual models (without the other heads), which have to be used at inference resp. prediction. Inspection of the latent parameters and cross-sectional similarities can be executed on the shared embedding layer.
MHER-DNN Model
The MHER-DNN, cf. Figure 2, is designed with three input heads, one for each cross-sectional type, i.e. CHS, RHS, SHS, and I as well as H. The input heads with feature dimensions \(d_{CHS} = 4\), \(d_{RHSSHS} = 8\) and \(d_{IH} = 9\) consist of fully connected Multi-Layer Perceptron (MLP) networks with ‘relu’ activation function, batch normalisation as well as dropout layers and feed into a shared embed-ding layer of dimension \(d_z\), which learns the similarities and differences between the cross-section types. The embedding layer output is then passed to the regressor MLP network (also with batch normalisation as well as dropout layers) for predicting the overstrength factor s given cross-sectional features for circular, RHS/SHS, and I/H profiles. The MLPs are designed as encoders with decreasing layer width, starting with NN nodes and a subsequent shrinkage at a rate of \(1/N_L\).
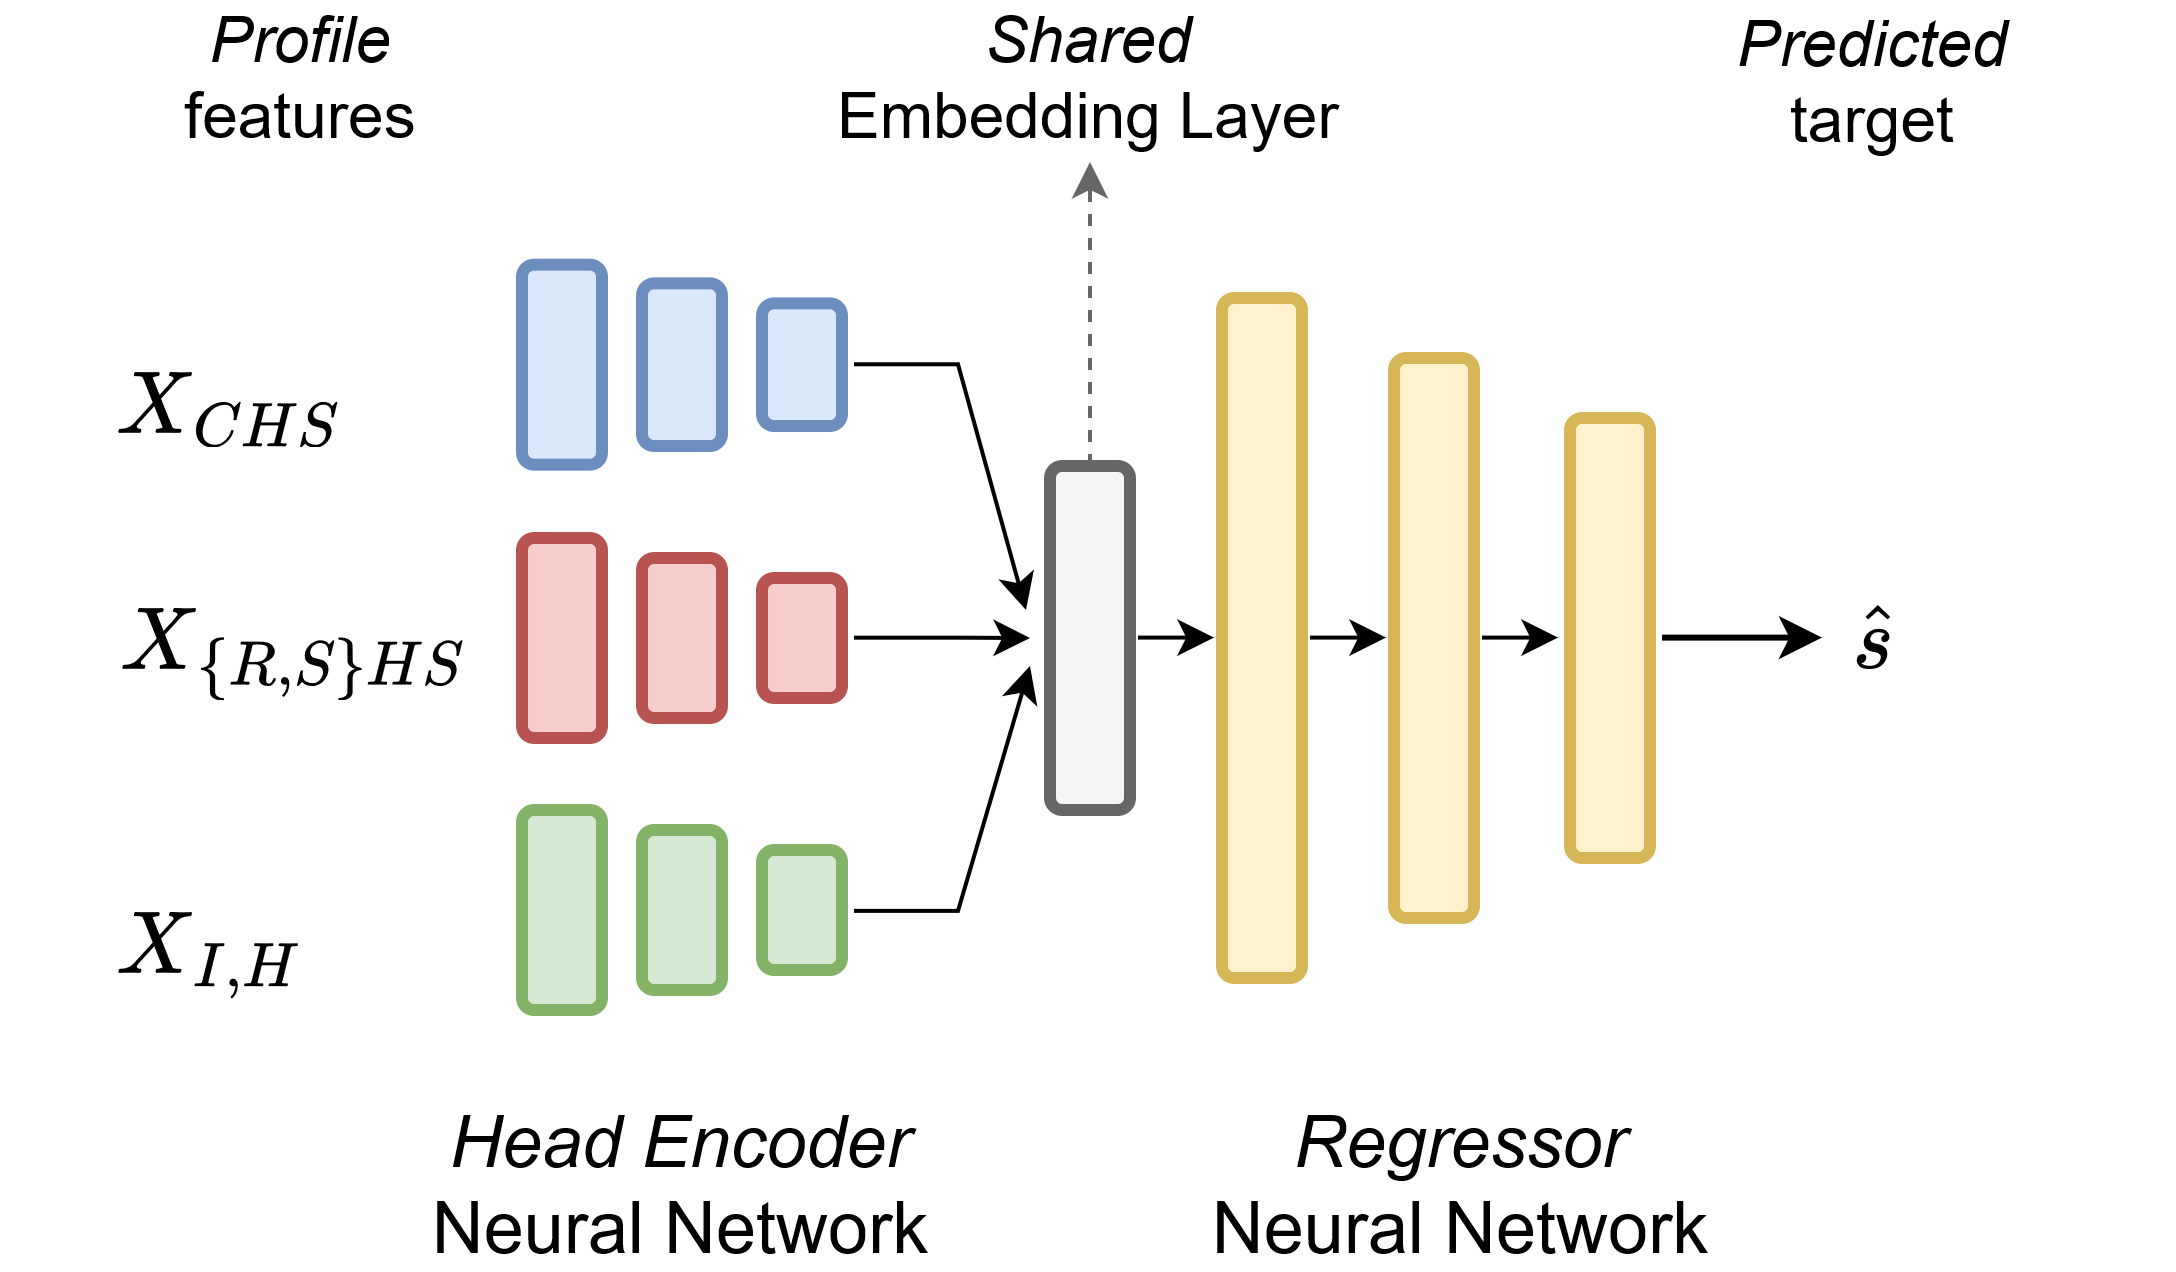
Figure 2: Multi-head encoder – Regressor Deep Neural Network (MHER-DNN) with shared embedding layer for predicting the overstrength factor \(s\)
given cross-sectional features for CHS, RHS, SHS, I and H profiles.
All MHER-DNN hyperparameters together with their search intervalls and final choices are summarized in the following table.
Table 1: DL architecture search space: hyperparameters and ranges for the gridsearch as well as final hyperparameter choices.
| Hyperparameter | Range | Final Choice |
|---|---|---|
| Number of Layers \(N_L\) | [2, 8, 32] | 8 |
| Number of Nodes \(N_N\) | [32, 64, 128] | 64 |
| Latent Dim \(d_z\) | [2, 3, 10, 15] | 3 |
| Dropout Rate \(r_d\) | [0, 0.25] | 0.25 |
Training and Validation of MHER-DNN
The data sets for CHS, RHS, SHS, I and H cross sections are split into training (80% of \(N_{S,i}\)) set, validation (10% of \(N_{S,i}\)) set and test (10% of \(N_{S,i}\)) set. The data sets were furthermore standardized before training to yield zero mean and unit standard deviation, where a data scaler function per section type was employed and calibrated using the training sets only. Due to the differing sizes of the single cross-sectional data sets within the data base, a custom data loader for consistent batch training was programmed to ensure a fixed batch length during training for the MHER-DNN.
A hyperparameter search was conducted in order to find the MHER-DNN architecture with optimal performance. The hyperparameters investigated are: number of layers \(N_L\), number of nodes \(N_N\) nodes, latent space dimension \(d_z\), and dropout rate \(r_d\), while the activation function was not changed, cf. table 1. The hyperparameters value ranges spanning the MHER-DNN’s search space as well as the final choices are provided in Table 1, where a grid search approach was used to find the optimal combination of hyperparameters. The results of the hyperparameter tuning can be found at our Weights&Biases project homepage .
Each MHER-DNN training run consisted of 2,000 update epochs with 10 training and 5 validation steps per epoch. We employed a MSE loss as objective without further regularization, where the Adam optimizer with initial learning rate of 0.001 is used. The training also enforces callbacks for learning rate reduction and early stopping for tracking the validation loss with patience of 120 respectively 200
A parallel coordinate plot, cf. Figure 3, is used to visualize the hyperparameters of MHER-DNN as well as the MAE computed by MHER-DNN on the test data sets of the cross sections. The parallel coordinate plot clearly highlights a trade-off between the test set MAEs of the overstrength factor \(s\) of the three NN models and their hyperparameter choices without a clear favourite choice. Hence the choice of the final MHER-DNN hy-perparameters can only be made in a Pareto optimal sense. Therefore we use the average MAE on the test sets (represented by the colorbar) as decision criterion for choosing the values reported in table 1.
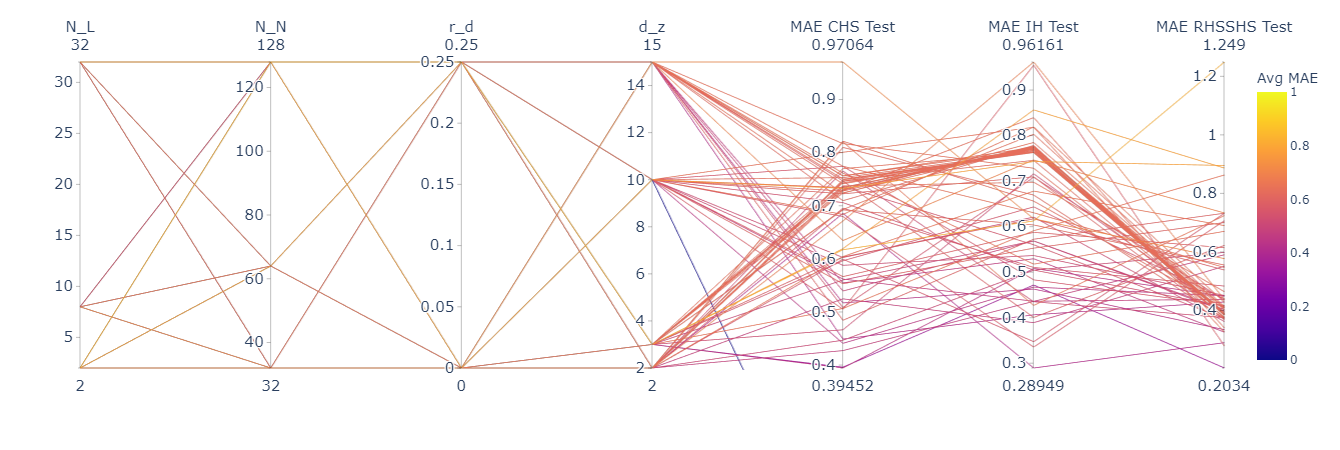
Figure 3: Parallel coordinates plot of the hyperparameter tuning including MAE test data results as well as the average MAE score.
Figure 4 provides plots for comparing predictions \(\hat{s}\) and ground truth data \(s\) for the finally chosen MHER-DNN hyperparameters for all cross sectional data sets (while different markers indicate training, validation and test data sets).
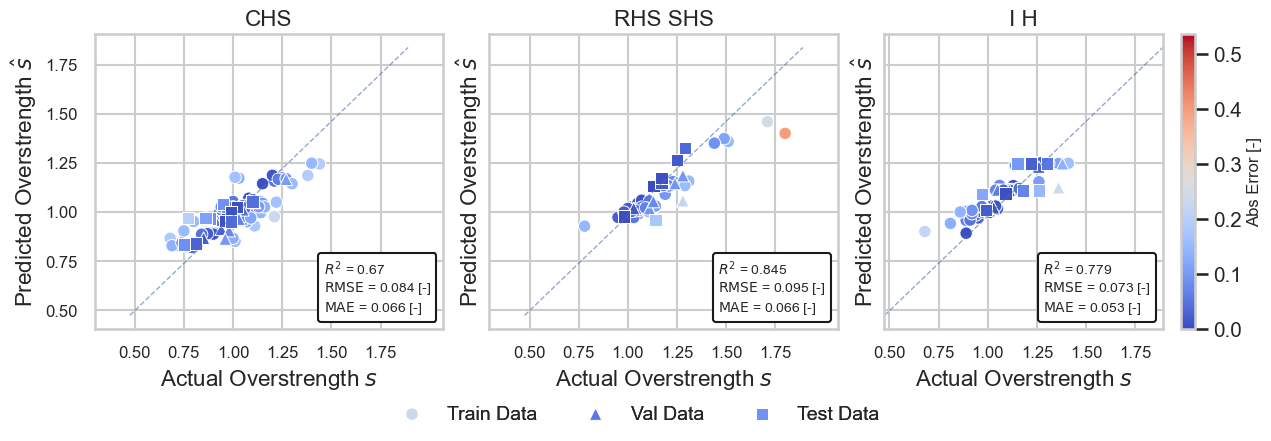
Figure 4: Prediction capability of the MHER-DNN model on the train, validation and test data sets over all cross sections.
First, it should be noted that the three MHER-DNN cross sectional sub-regression models predict their respective targets very well as proven by the respective reported RMSE, MAE and \(R^2\) values. However, approximately linear deviation trends with different magnitudes can be observed. In order to investigate the deviations more closely, Fig. 5 compares the performance of the proposed MHER-DNN models by plotting the overstrength ratios of predictions s ̂ against the corresponding experimental normalised by the experimental ground truth values s.
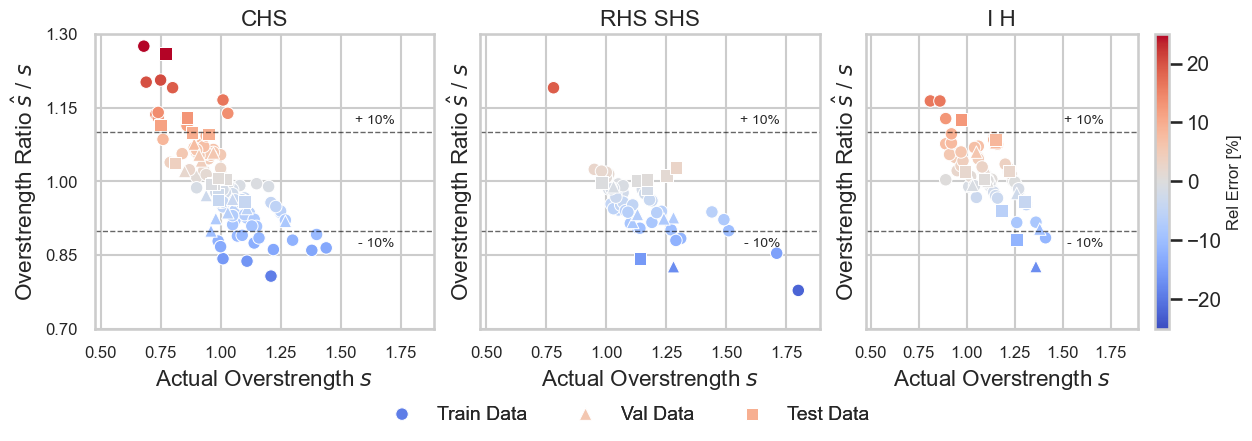
Figure 5: Prediction capability of the MHER-DNN model on the train, validation and test data sets over all cross sections.
In Fig. 5, a normalized value of 1.0 represents a perfect estimation and indicates the most accurate prediction performance area. It can be seen, that most values are within a precision band of \(+/- 10\%\), where the linear patterns of predictive deviations confirm model dependent heteroscedasticity. The sub-model deviations manifest in the form that smaller value ranges (on the left side of the diagrams) are generally underestimating overstrength whereas larger value ranges are rather overestimated. The coefficients of variation (CoV) for the cross sectional MHER-DNN sub-models are around 0.14 and would now allow for the determination of the design values for predictions given by the sub-models together with partial safety factors in accordance with Annex D of EN 1990, which is omitted at this point.
Latent Space Inspection and Interpretation
A key feature of the proposed MHER-DNN model is inspection of the cross sectional embeddings into the latent space variables of the shared layer. Latent space inspection is a critical step in evaluating the performance of a deep learning model and gaining understanding of the latent structure within the data. In this regard, the latent space is a low-dimensional representation of the cross sections within the data set learned by the MHER-DNN model during training. As the finally chose MHER-DNN possesses a three dimensional latent space, no further dimensionality reduction e.g. via \(t\)-distributed stochastic neighbour embedding (t-SNE) or Uniform Manifold Approximation and Projection (UMAP) projection is necessary for human perception.
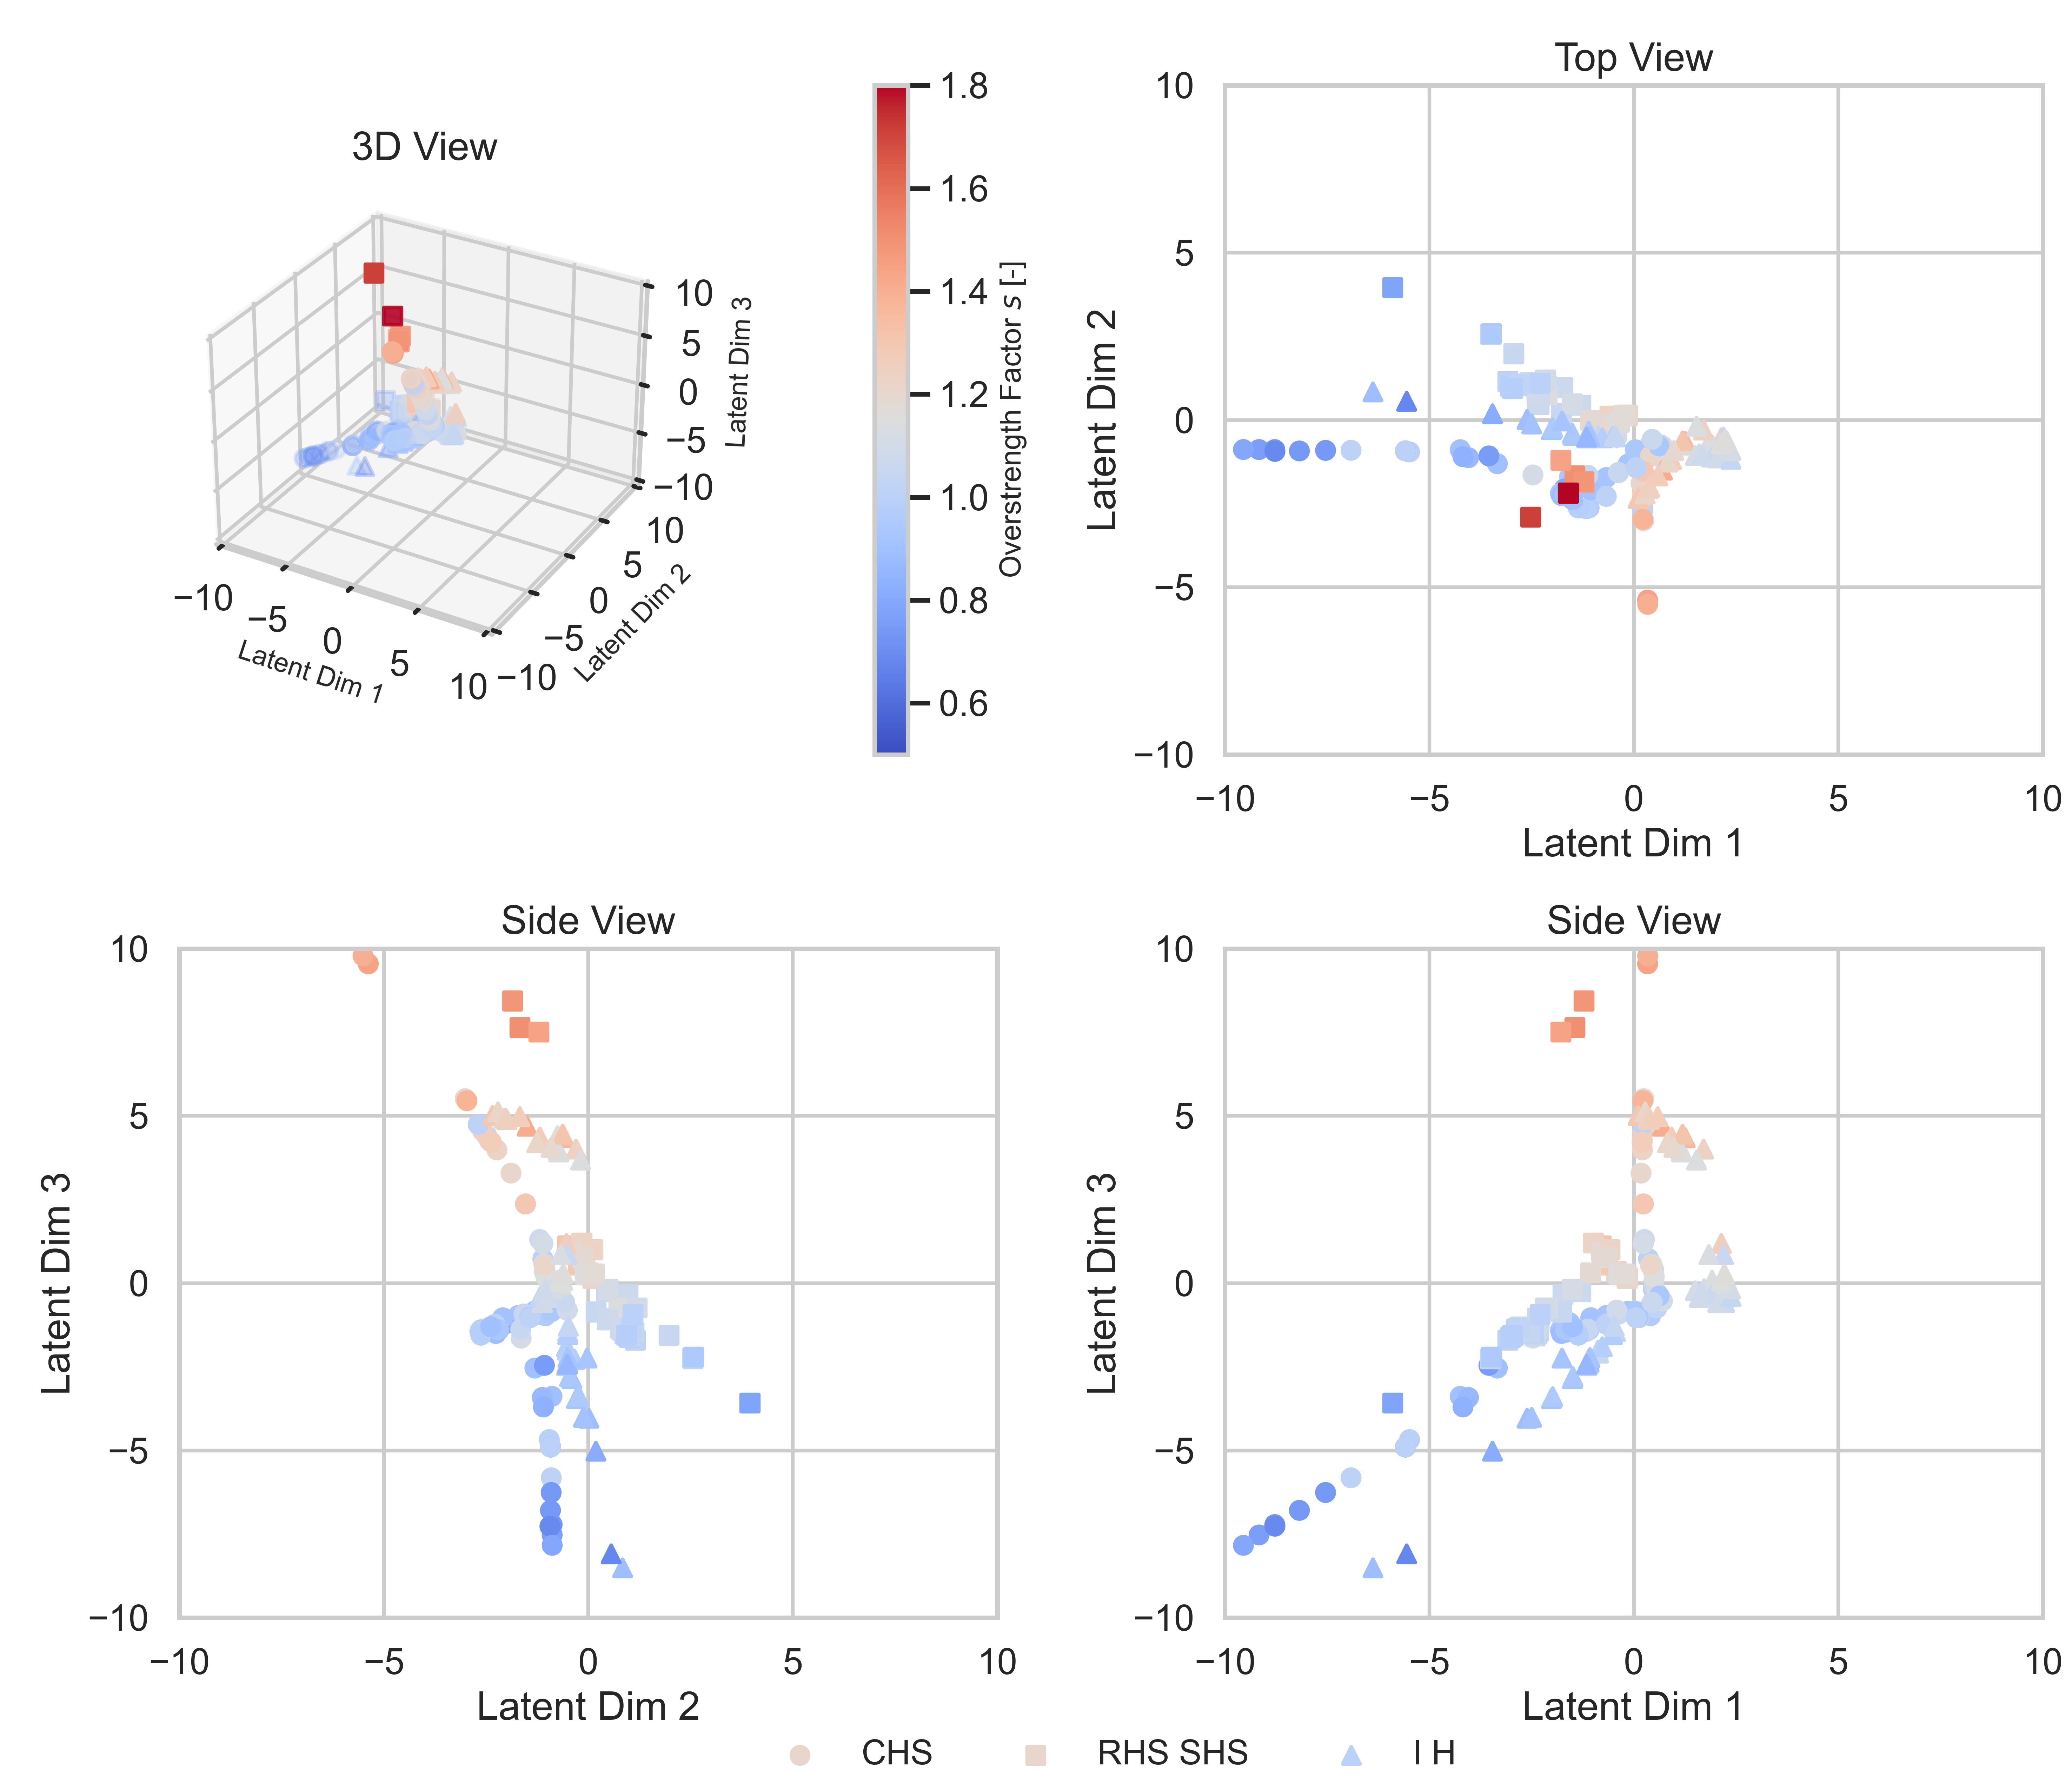
Figure 6: Visualisation of the 3-D latent space spanned by the coordinates of the embedding layer of MHER-DNN.
Fig. 6 provides a visualisation of the latent space as 3D plot together with projections in the latent dimen-sions as top and side views. Cross sections are indi-cated by markers while the colouring highlights the overstrength factor. By examining the visualization in Fig. 6 humans can get a sense of how the MHER-DNN has learned to separate the cross sectional input data together with detection of clusters in the latent representation of the input data. It especially allows to recognize, that the model detected several cross sectional clusters in the latent space. The individual clusters seem to possess a 1-dimensional intrinsic dimension (as the data are aligned on one line), however multiple branches within the 3D space can be recognized. Further model archi-tecture changes as well as feature engineering is nec-essary to further improve the overall model perfor-mances due to the obvious intrinsic correlation clusters between the cross sections w.r.t. the overstrength.
Conclusions
This study addresses the regression of overstrength factors for specific types of steel sections. We propose novel methods for formulating relations between cross-sectional features and the overstrength of beams in CHS, RHS, SHS, I, and H sections. We introduce a multi-head encoder-regressor Deep Neural Network (MHER-DNN) architecture to predict the overstrength factor and learn a compressed representation of section-specific inputs for regression and inspection purposes. Experimental data for different cross sections are used to train and validate the MHER-DNN. The model shows reasonable precision and accuracy compared to existing models. We also explore the disentanglement of the latent space representation of the MHER-DNN, allowing for common feature derivation and human interpretation. Future research involves further tuning of hyperparameters, investigating hybrid autoencoder-multi-head regressor architectures, and establishing Eurocode-compliant models for engineering design practice.
Web Application
Now it is your turn to try out our neural network overstrength predictors yourself!
The web apps will be released soon!
Contributors

Senior Researcher in SciML4AEC and Co-Leader of the Immersive Design Lab of Design++ at ETH Zurich

Doctoral Researcher in Steel Structures and SciML4AEC at ETH Zurich

Doctoral Researcher in SciML4AEC at ETH Zurich

Professor for Steel Construction and Composite Structures at ETH Zurich
Contact
Dr. Michael A. Kraus, M.Sc.(hons) Institute für Baustatik und Konstruktion (IBK) ETH Zürich kraus@ibk.baug.ethz.ch Visit Dr. Michael Anton Kraus
Shield: ![]()
This work is licensed under a Creative Commons Attribution 4.0 International License.
